2014 Collision Data
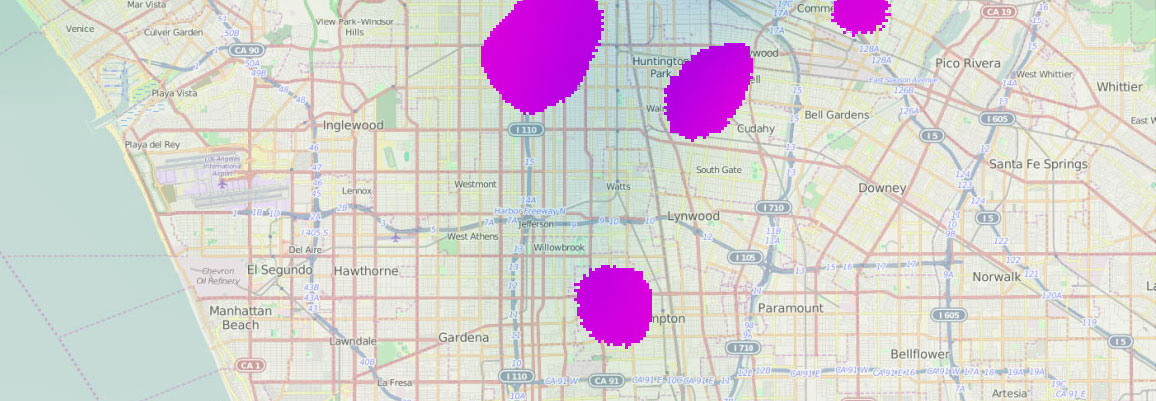
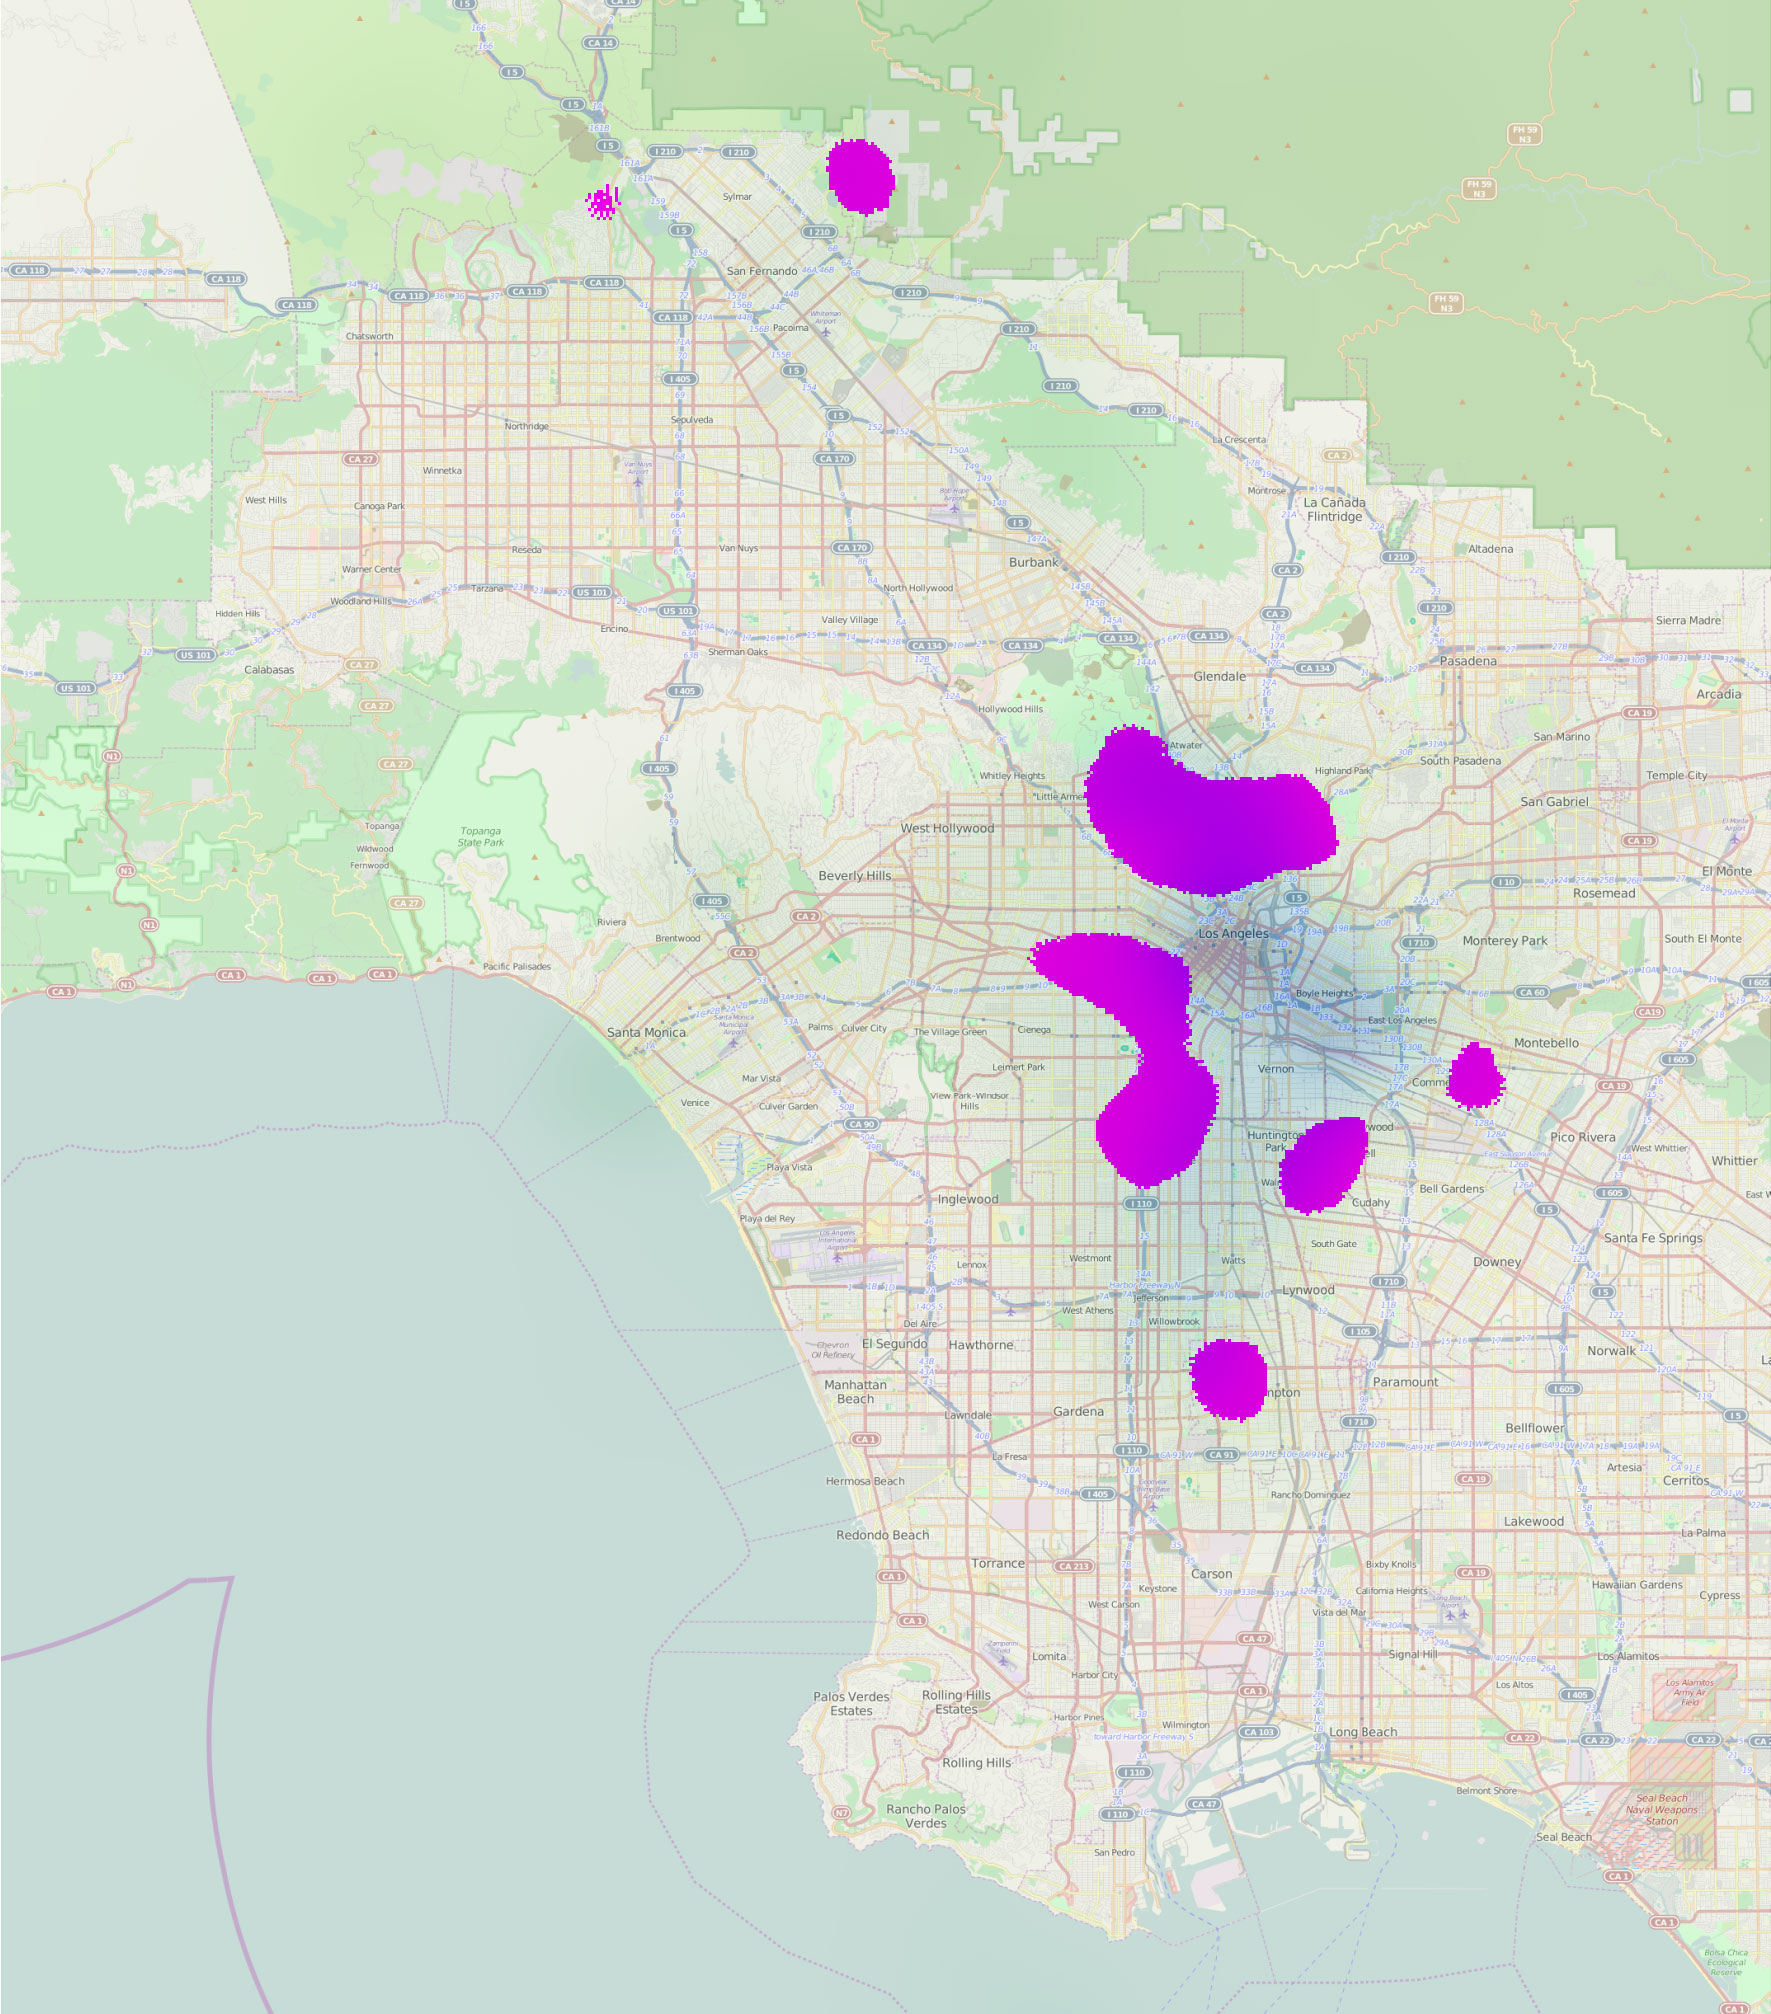
October 15, 2015Here are our updated shapefiles for collisions in Los Angeles through 2014.
- lacity_switrs_bike_ped_2003-2014.zip contains all reported collisions in LA involving pedestrians or cyclists, 2003-2014
- lacity_switrs_2003-2014.zip contains all reported collisions in LA, 2003-2014
The source data for these shapefiles came from @RoadSafeGIS who generously compiled the most recently available SWITRS data for the city of Los Angeles into Esri’s FileGDB format. Thanks to @VisionZeroLA for pointing us to it!
What changed

Processing
We transfored the data using a one step script we wrote and published on github. That script will show you exactly what we did to the data.
Using that script we transformed the RoadSafe data into shapefiles. As well as being larger and slower than Esri FileGDB, shapefiles are a legacy format that boast a 10 character limit on your attribute column names. For example ‘BICYCLE_ACCIDENT’ is truncated to the impenetrable ‘BICYCLE_AC’. Rather than invent our own short names, we used the headers from the TIMS project.
So why would we choose to use this terribly crusty out-of-date format? Well, for one, FileGDB is 10 times slower while using, QGIS (my desktop GIS of choice). I suspect, but cannot confirm, that if you are using ESRI ArcGIS that there would be no upside to using these shapefiles over the ESRI FileGDB format, and you’d best use the upstream data sources straight from RoadSafe GIS.
We also projected the dataset to EPSG:2229 (California Zone 5), a common projection for Southern California which allows us to easily interact with the data using US feet instead of degrees.
Let us know if you see any errors with or have any questions about this data.