Why Does USC Have So Many Dangerous Intersections?
September 01, 2015Our original goal was to write an article about the dangerous intersections across the entire city of Los Angeles. We ranked intersections by the number of cyclist injuries reported in our collision dataset, spanning 2002-2012. But there were so many patterns and so much data that any conclusions drawn would be very high level and not very useful. Instead we’ve decided to publish a series of more specific articles on the topic. Each article will dive into a particular neighborhood or focus on a single pattern emerging from our analysis. When we refer to the worst or most dangerous intersections, we are referring to intersections that have the highest numbers of reported incidents resulting in cyclist injuries or deaths.
By this metric, four of the five most dangerous intersections in all of Los Angeles are at USC. While the University’s large cycling population likely contributes greatly to the high frequency of collisions, the sheer number of injured cyclists makes this an area well worth studying when discussing new legislation and infrastructure, regardless of the per capita injury rate. In the rest of this article we go into more detail about where specifically these injuries are happening and why they might be occurring.
Dataset
This analysis is based on data pulled from the TIMS project out of Berkeley which in turn gets data from the California Highway Patrol SWITRS database. It encompasses collisions reported to law enforcement between 2002-2012. The actual number of incidents may be worse where collisions go unreported.
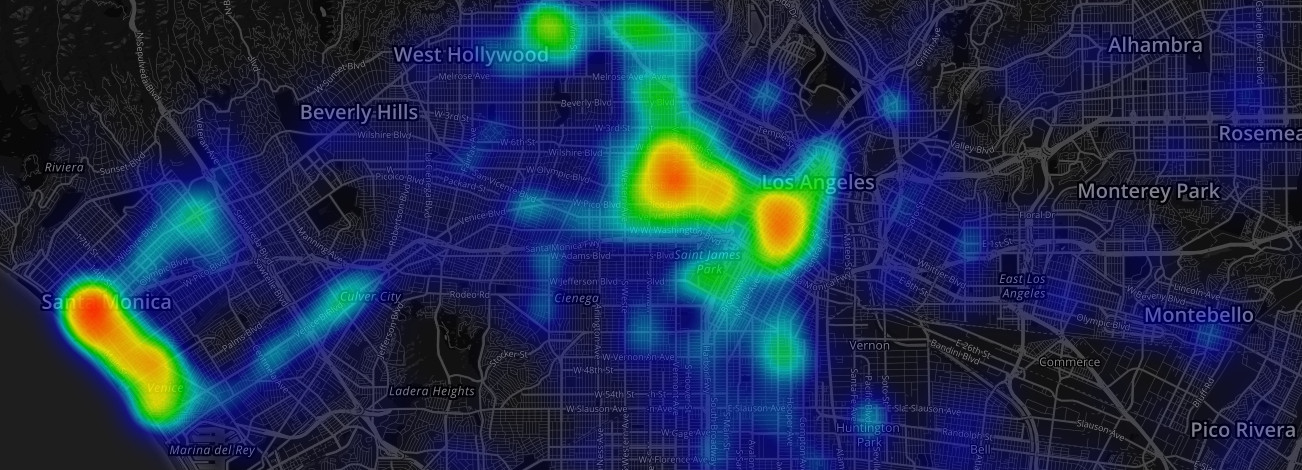
This data is somewhat old. With cycling on the rise, the number of people affected and potentially at risk for injury or death while cycling in the city is certainly growing. Take a look at our heatmap of bicycle collisions in California to get a visual idea of how bicycle collisions are growing in different areas over time.
You can read more about how we generated these figures and download all our data by reading our how-to article.
The Intersections
The Worst
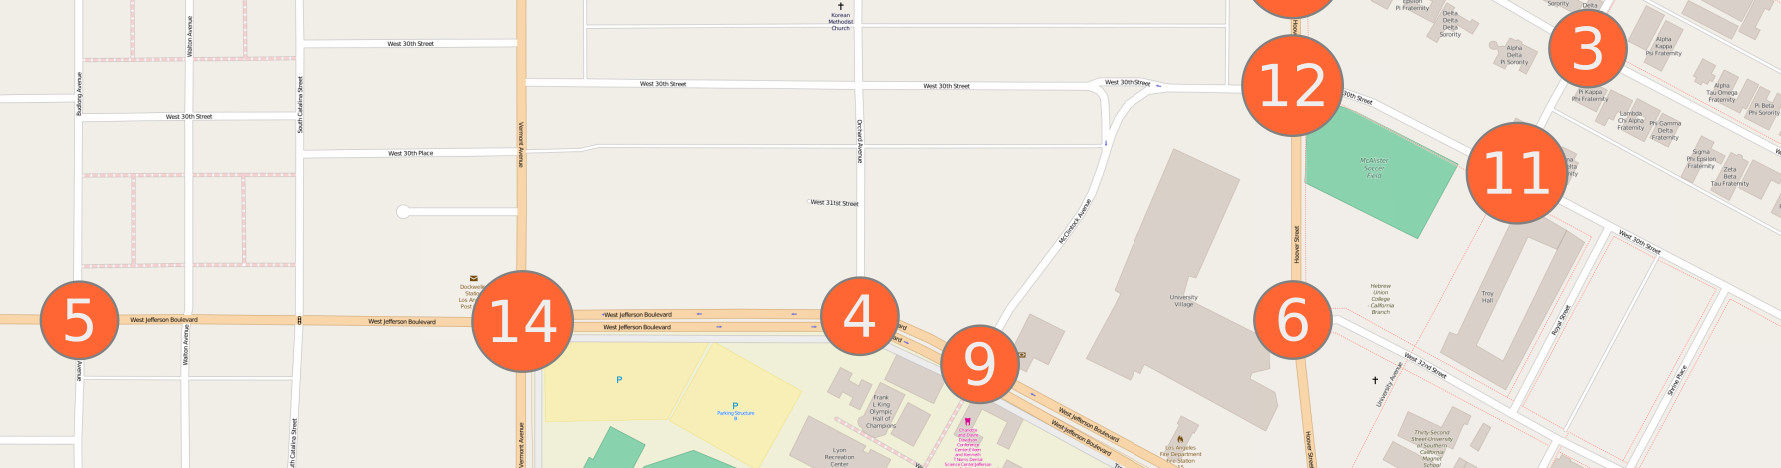
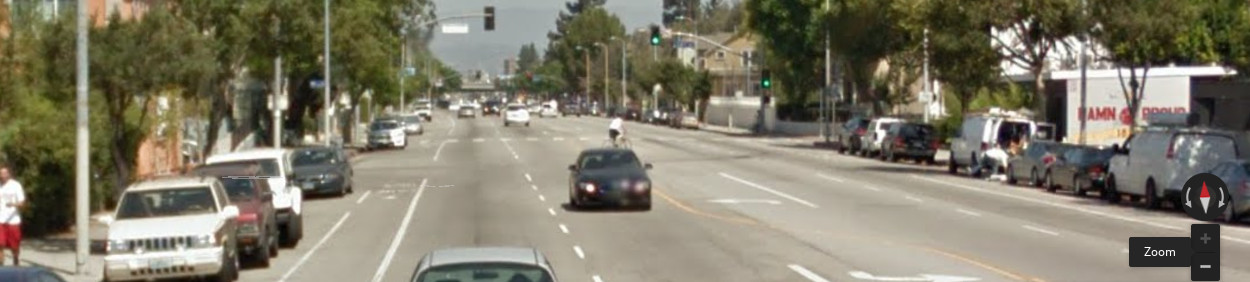
The worst single intersection near USC can be found at Jefferson & Vermont, where 14 cyclists were injured during the data collection period.
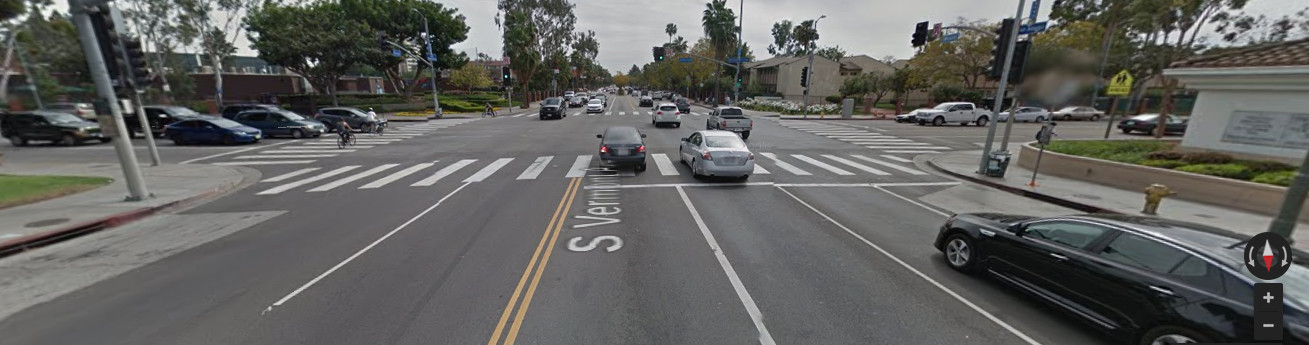
Considering the high automobile traffic, proximity to USC (lots of cyclists), and complete lack of bicycle infrastructure, it’s not surprising that so many injuries happen here.
Hoover, the Real Worst
Hoover at 28th, 29th, and 30th all have a very high number of injured cyclists. Respectively there were 12, 13, and 12 injuries reported at each of these intersections. That’s 37 cyclists injured by cars in just a few blocks.
What’s going on here that so many cyclists are being injured? Of course part of it is due to the high volume of cyclists on Hoover. Hoover is a major collector street, funneling everybody from the north side of campus. Is there anything in the environment we’ve built contributing to this? Let’s take a look.
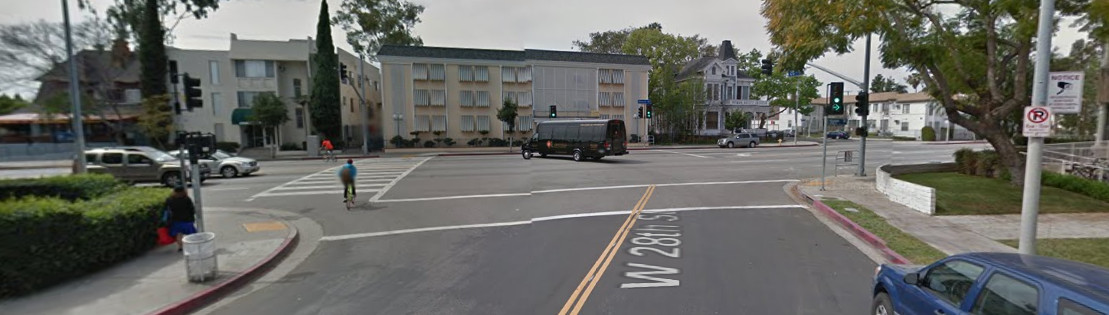
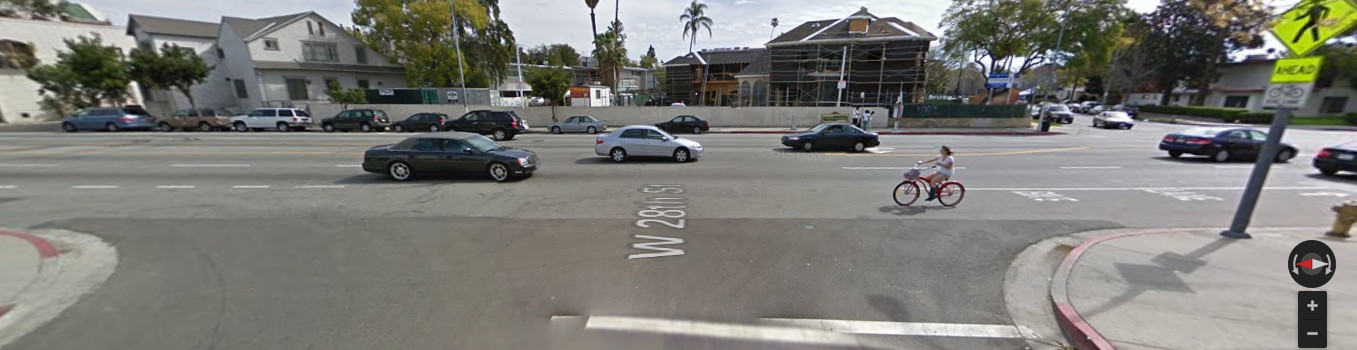
Hoover has had a bike lane since at least 2007. 28th crosses Hoover as a disjointed dog-leg intersection. Here’s the view from the other side.
29th terminates into Hoover at a T-intersection. 30th is a regular four-way intersection. However, there is a bend in the roadway just east of Hoover on 30th.
Observations
In looking at these intersections, I’m struck by two things.
The first is the unsafe cyclist behavior. To be clear, when looking through Google Street View, we did seek out images with cyclists, but we didn’t specifically seek out cyclists acting unsafely, apparently it’s just that common. For example, take another look at that last street view of 29th and Hoover, where the cyclist runs the red light to turn left across traffic. Pan right and what do you see?
We’re definitely not here to blame the victims in cases where riding behavior could have prevented an injury. For one, we don’t believe that bikes should always ride like cars drive. But this article isn’t about “ethically correct cycling behavior.” For that you can read any number of angry cyclist forum threads. Regardless of what is “correct,” we want cycling to be safer, and just telling people to “be more careful” is not a very effective strategy. Ridazz gonna ride.
Luckily, we know that behavior and the built environment are inextricably linked, which brings us to our second observation. For as many cyclists as there are riding around USC, there is a severe lack of cycling infrastructure. Currently there is only an unprotected bike lane on Hoover and some sharrows painted on 28th and 29th. We can do better. As one of the most cycling dense neighborhoods in Los Angeles, USC presents the perfect opportunity for investing in better infrastructure to protect cyclists and promote safer riding behavior.
Hoover’s bike lane should be separated or at least buffered. 28th and 29th should be striped to make visible where cyclists will be funneling into Hoover. Maybe the light at 29th & Hoover should be shorter. Converting the intersections at 28th, 29th, and 30th to roundabouts could promote safer traffic mixing and lower speeds in intersections. Hoover terminates into Jefferson just one block south of 30th anyway - automobiles don’t need to be traveling fast here. There is a smorgasbord of design options to make cycling safer near USC.
Stepping Back
When we began our analysis looking across all of LA, it became clear that there were intersections with inordinately high number of cyclist injuries. This is sometimes due to a higher volume of cyclists and sometimes a lack of adequate cycling infrastructure in these neighborhoods.
In particular USC and the Vermont corridor are ripe for safer mobility infrastructure like bike lanes and traffic calming. But beyond these clusters, most of the dangerous intersections in Los Angeles are scattered. From Santa Monica to Boyle Heights, from Canoga Park to the Port, it’s clear that better comprehensive planning and engineering is required across the city.
This is not to say that there aren’t patterns that deserve priority in treatment. Similar to the recent LA Times Analysis of Dangerous Pedestrian Intersections, we found that 25% of cyclist injuries occurred at 1% of the intersections in Los Angeles. These intersections are prime candidates for improvement in line with Los Angeles’s recently approved mobility element which lays out some new standards and strategies for how the city plans and builds its transportation systems to facilitate all modes of travel, not just automobiles. In particular, Garcetti’s vision zero component declares that each traffic death must be viewed as a failure, necessitating changes in infrastructure and/or policy, with a goal of reducing traffic fatalities to zero by 2035.
You can read the full text of the mobility element here.
What Next?
We hope you found this analysis interesting, and maybe even useful. If you are interested in looking into our methods, check out our how-to article. It’s not hard to get started, and we’re excited to share and learn with other folks who want to use data to help draw conclusions about the world around us.
We will continue to research and talk about cycling safety in Los Angeles, not only from behind our computer screens with statistical/geospatial analysis, but also from our bikes. We personally experience the physical environmental factors on the street that make some of these routes so dangerous, while other routes offer a safe, economical, and fun way to get around.
Comments, Questions, and Suggestions for future research? contact us.